Plot Method for HAL Conditional Density Estimates
Arguments
- x
Object of class
haldensify, containing conditional density estimates, as produced byhaldensify.- ...
Additional arguments to be passed
plot, currently ignored.- type
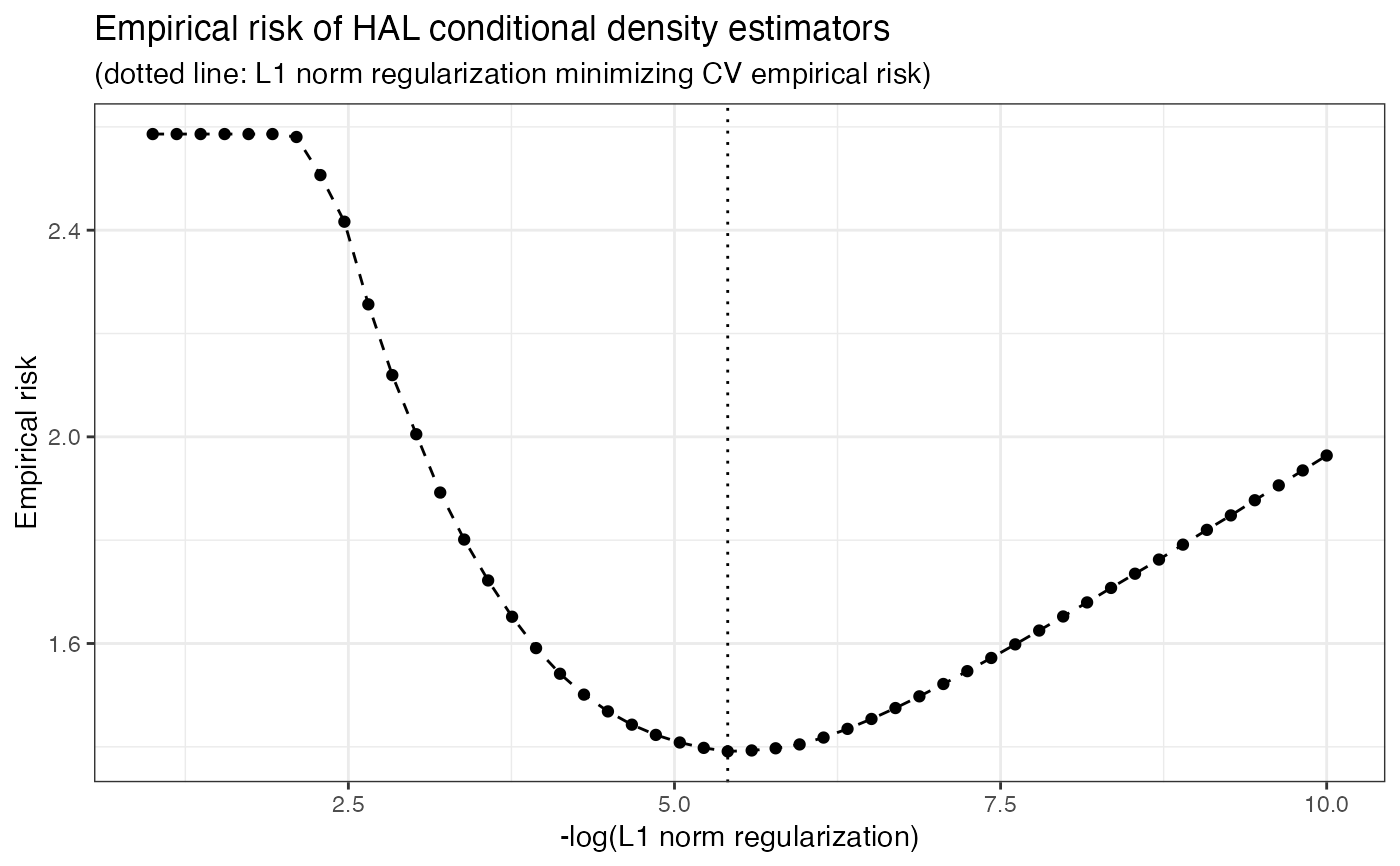
A
characterindicating the type of plot to be produced. Options include visualizing the empirical risks of the conditional density estimators across a grid of values of the regularization parameter and a plot of the estimated conditional density (based on the estimator selected by cross-validation). The latter has yet to be implemented.
Examples
# simulate data: W ~ U[-4, 4] and A|W ~ N(mu = W, sd = 0.5)
n_train <- 50
w <- runif(n_train, -4, 4)
a <- rnorm(n_train, w, 0.5)
# learn relationship A|W using HAL-based density estimation procedure
haldensify_fit <- haldensify(
  A = a, W = w, n_bins = 3,
  lambda_seq = exp(seq(-1, -10, length = 50)),
  # the following arguments are passed to hal9001::fit_hal()
  max_degree = 2L, smoothness_orders = 0L, reduce_basis = 0.1
)
plot(haldensify_fit)